How to get guests in your bed – a strategic guide to get more bookings

Analyse clients

Written by Mqondisi Gumede, Man and Machine

One of the difficulties of marketing in travel is that it is a very large place that boasts an incredible array of beauty. It is a never ending pageant of scenery, culture, beauty, culinary delight, diverse experiences and accommodation establishments at their best décor and service.

In such a situation, most hoteliers will have found that, as justifiably proud of their establishment’s charms as they are, there are other establishments with different but no less compelling offers to potential guests.

In this situation, what are hoteliers to do? Our response is to develop a strategy.

One of the hallmarks of strategy is to answer the question ‘WHO?’ first, before you answer the question ‘WHAT and HOW?’ (To understand why this order is important, I make the argument in the post – A strategic marketing approach to get a date ahead of Brad Pitt. In essence being tactical, approaching this problem from a first ‘WHAT’ and ‘HOW’ perspective, will render you far less likely to succeed than approaching the challenge from a first ‘WHO’ then ‘WHAT’ approach.

Gaining clarity on who for all businesses, especially hotels, has so far been a very difficult affair. Recent conversations have pinned hopes on big data, hoping that, if businesses had more data they would be better at generating insight. Nothing could be further from the truth. All that we have today are businesses that have a greater amount of data but generally still have the same scarcity of insight.

In your pursuit of understanding the ‘WHO’, it is important to focus on insight. Here are the 2 main reasons:

1) WHY is the power.

In the movie The Matrix Reloaded, Neo (the One) goes to visit the Merivingian. An entertaining passage of dialogue ensues that culminates in the Merivingian asking Neo: “Why?” The star of the movie hesitates and offers no answer, the Merivingian, incredulous, admonishes him saying:

“…Why is the only real source of power, without it you are powerless. And this is how you come to me: without why, without power, another link in the chain.”

Then, he dismisses him in the following fashion:

“But, fear not, since I have seen how good you are at following orders, I will tell you what to do next. Run back, and give the fortune-teller this message:…”

In the world of appeal, nothing can be more valuable than understanding why people do what they do. Imagine how you could change your marketing, your Facebook page, your website, if you knew why people travelled at all and why they choose the travel experience providers they do.

This is perhaps the most important prerequisite to being able to have a compelling offer in a crowded travel and tourism industry, if you can understand the why of the people that are likely predisposed to choosing your establishment.

As difficult as it is, there is no greater guarantee of success in marketing, online or not, but locating the reasons, the why, of your target market’s travel choices. This may not be the fastest or easiest route but it is the surest route to marketing and booking success:

2) Start by getting a better understanding of the people who have stayed with you before.
Many businesses go after more and more data when they do not use the current data they have to gain rich insight which remain the same even if they analysed 100 times the data.

To avoid this huge missed opportunity, think of all the people that have booked at your establishment and all the conversations you’ve had, all the reviews and social media mentions that you’ve read about your establishment and answer the following questions.

i. Try and list the 3 largest groups of people that emerge.
ii. Once listed ask yourself and/or key members of your team, why they chose your establishment?
Once you have the first answer, ask “why is that important?” and as you get an answer repeat the process for 5 whys.

If you don’t get beyond 2 or 3 whys, it signals that there is some work to do in understanding the motivations of your targeted audience and would not keeping your marketing activity to a moderate level until you can have this conversation very casually with your new guests over the course of the next weeks.

Once you can get to 4 or 5 whys for the top groups that stay with you, you will now understand why they travel and why they make the travel choices that they do.

This insight, will start to shed light on who your audiences are and the best way to prosper in trying to appeal to them.

In our next blog post we’ll discuss how to apply this new found power. If you feel you need more detailed analysis, we at Man&Machine combine the understanding of people, strategy, marketing and digital and put them together in a way that works best to get you more guests to your establishment. We will be able to apply a host of techniques that can provide you with a clearer view of the people who have stayed at your establishment as one of the inputs to greater marketing efficacy in the online space.

www.manandmachine.solutions


Your management checklist

hdbttn-e1441996503991

Written by Paula Chaplin

How you track your business is dependent on how your systems are set up, what your processes are, and how you structure your roles and responsibilities. Even with these being unique to each of our customers, there are still basic checks you could be working with to help manage your business better.

I’ve put together a checklist of some our most popular management areas and the reports we recommend you use to help manage those areas.

To review internal staff workloads

  • Which consultants are creating bookings – Consultant report and Financial Analysis reports
  • Which consultants are converting bookings – Consultant report and Audit report

To check for fraud / irregularities

  • Agent name change – Reservation Audit Trail and Audit report
  • Reservation name change – Reservation Audit Trail and Audit report
  • Reservation date change – Reservation Audit Trail and Audit report
  • Voided payments – Payments received reports
  • Cancelled close to, or after, travel – Financial Analysis reports
  • Bookings travelling unpaid / part paid – Financial Analysis reports

Financial management

  • What’s outstanding? Payments Due report
  • What Credits / Refunds are being issued? Payments received reports
  • What Invoices have been voided? Folio / Invoice report
  • Checking that reservations are paid before travel – Payments Due report
  • Writing off underpayments – Folio / Invoice report
  • What do your debtors owe? Payments Due and Debtors reports

Reservations management

  • Are your Provisional Bookings being managed? Provisional Expiry report
  • Check on Overbookings – Overbooking report and Occupancy calendar
  • Check on bookings with Overrides – Financial Analysis reports
  • Check Waitlisted bookings – Standard and Financial Analysis reports (or Requests Received and Component reports)
  • Cancellations – check cancelled date, vs confirmed date and charges – Financial Analysis report

Property management

  • What activity should the lodge prepare for? Operations Chart and Arrivals / Departures reports
  • Who arrived / stayed longer / didn’t arrive? Rooming Discrepancy report
  • What transactions happened at the lodge? Sales Analysis / Sales by Folio / Sales by Reservation reports

Tips for when running reports:

  • Check Report Profiles reflect correct / current Rate Types and Accommodation Types. This should be done every time Rate Types or Properties / Accommodation Types are added to the system.
  • Deactivate Extras no longer in use.
  • Move Users into “No Longer Here” User Group as soon as they leave the Company. (You should not delete Users).

Tracking your business using reports can help you see trends, spot inconsistencies, measure performance and predict upcoming events. This analysis can help you plan changes to your resources, pricing and sales strategies in order to secure and grow your business.

For more help on profiling reports, please contact [email protected].

You might like this related article: See your business clearly.

See your business clearly

Written by Paula Chaplin

This is the time of year you start looking forward and trying to gauge what the year ahead will bring. If you happen to be in a region beset by issues (perceived or real) negatively impacting tourism (terrorism, ebola, government unrest etc) – this is probably quite a trying exercise. Unfortunately we can’t help you predict the future – our crystal ball is still downloading…

But what we can help you with is forecasting data in ResRequest – which you can interpret (because no-one knows your business like you do) and try to spot booking and travel trends, which may give you a reasonable idea of what next year will be like.

To that end – we have put together some reports (all of which you can pull out of ResRequest) – and added some graphs (we used Google Spreadsheet, but you could use Excel or Numbers) – to give you an idea of the kind of information you can get from ResRequest, and different ways of viewing it.

The numbers we’ve shown are fictional, and not representative of any company’s actual business. The point of this mailer isn’t the figures – it’s the concept of data interpretation and visualisation.

We show you below how to pull the reports which are feeding these graphs – but your company will be set up in a unique way, possibly with properties, accommodation types or rate types that should be excluded from statistical/revenue reporting. If you want to be 100% certain that you are looking at accurate and relevant data – please get in touch so we can go through it with you.

It’s important to note that our reports are only as good as the data you capture. If you are not capturing data consistently – your reports will not give you an accurate or complete picture of your business.

The information I used to create these graphs was pulled from either the Sales Analysis or, my personal favourite, the Financial Analysis Report. To find this information, and much, much more, I’ve prepared a guide on how to use the Financial Analysis Report. If you prefer that we talk you through this step-by-step just drop us an email. Enjoy!

Future bed nights: comparing previous years

Looking at what your bed nights were like this time in previous years, relative to how the year turned out. 
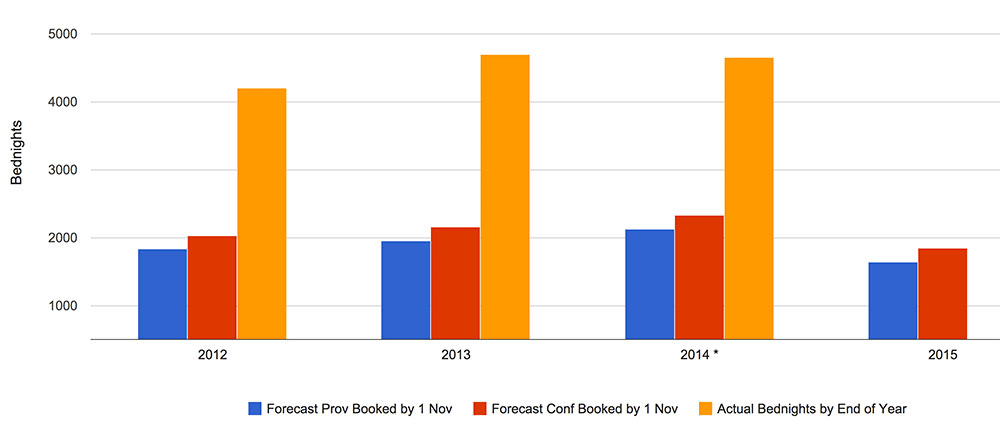
(To pull information for this graph: you need to run a report per year and stitch the information together. To see bookings as of 1 Nov 2013 for 2014: Travel Dates = 1 Jan – 31 dec 2014, Create Date = 1 Jan 2000 – 31 Oct 2013. Group by Status, showing Bednights.)

Booking lead time

Look at booking trends – how far in advance do your reservations come in. 
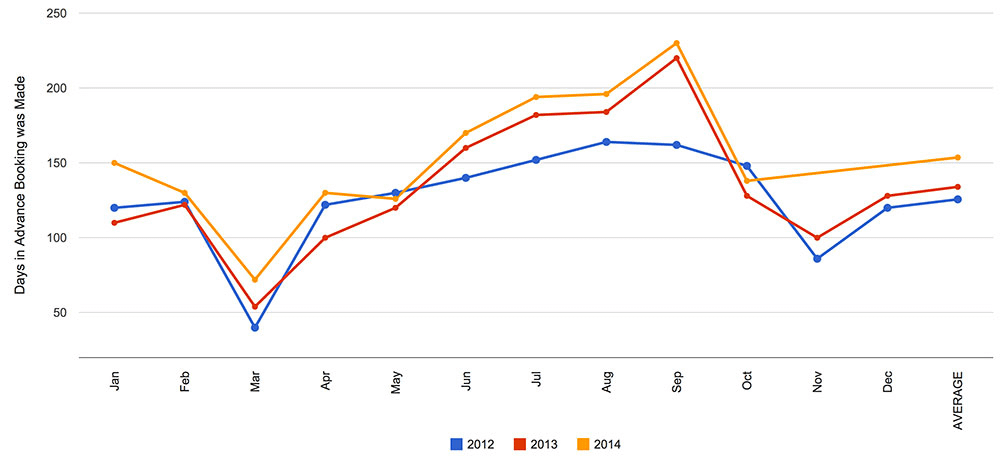
(To pull this report look at the FAR – Group by Create Date, and look at Arrival Date. Export the report and create a variance column between Arrival Date and Create Date – this is your lead time.)

Revenue compared with Yield

We know you are interested in yield, not just bed nights. By combining your revenue and yield on one chart, you can see pricing trends for each property, or year.

(To pull information for this bar graph, I ran the FAR report, grouped by property, showing net revenue and yield.)

Recognise your top agents

You need to know which agents are your top performers. By plotting your top agents for the last 2 years, and your forecasted agents for the next year, your marketing team can quickly see who to check-in with, or applaud.

(To prepare data for this chart, I ran the FAR report, grouped by agent and sorted by revenue.)

Know where your business comes from

Knowing where your business comes from can be an effective tool as you develop your marketing and sales strategy. Measuring your reservation source shows you which campaigns were the most successful.

(This report was easy because my database had source code information, I generated the results using the FAR report, grouping by source code and sorted by revenue.)

Trending markets

See where your business is coming from geographically by tracking reservation nationality or tracking where your agents are based.


(This was super easy, I ran the FAR report, grouped by the agent postal code and sorted by revenue. The trick to this chart working is that your agents must have their postal (or physical) address details recorded!)