Get Insite – Leverage your data for smarter decision making with ResInsite
ResInsite is here to leverage your data for smarter and faster decision making – saving you time, optimising your revenues and launching you into the world of big data on a flexible and intelligent platform.
Your business quietly collects millions of rows of data – whilst you are expertly tucking your guests into bed for a good night’s sleep – ResInsite is churning those rows into deep insights and smart business decisions. The Results? More guests to tuck away and more time to focus on perfecting the art of a memorable stay.
Using QlikView, a charting tool, Pomerol Partners have worked with ResRequest to bring you ResInsite – a business intelligence application. ResInsite graphs your ResRequest data so you can make smart decisions based on your data trends. An in-the-cloud solution that offers guided insights into what has made your business a success and how to keep it trending upwards.

Traditional approaches to hospitality analytics are time consuming and often filled with best guess scenarios cobbled together on platforms like Excel. Now you can deploy award-winning software in your business that offers guided analytics, driving faster responses to the changing business environment without the need for costly development and the associated teething problems. Easy to deploy, tried, tested, effective and the perfect match for your ResRequest platform – ResInsite promises to mature your organisations’ approach to analytics and data with stunning results.
ResInsite has been lovingly developed over two years on the award-winning QlikView platform. It is an in memory, in the cloud, SaaS (software as a solution) deployment that requires no costly additional licencing or development.
ResInsite connects daily to your ResRequest data in an ultra-secure environment that protects your hidden data – but brings it visually to life.


- ResInsite uses the most intelligent and flexible platform for turning data into knowledge.
- It connects daily to ResRequest for live insights and fast responses to an ever-changing environment.
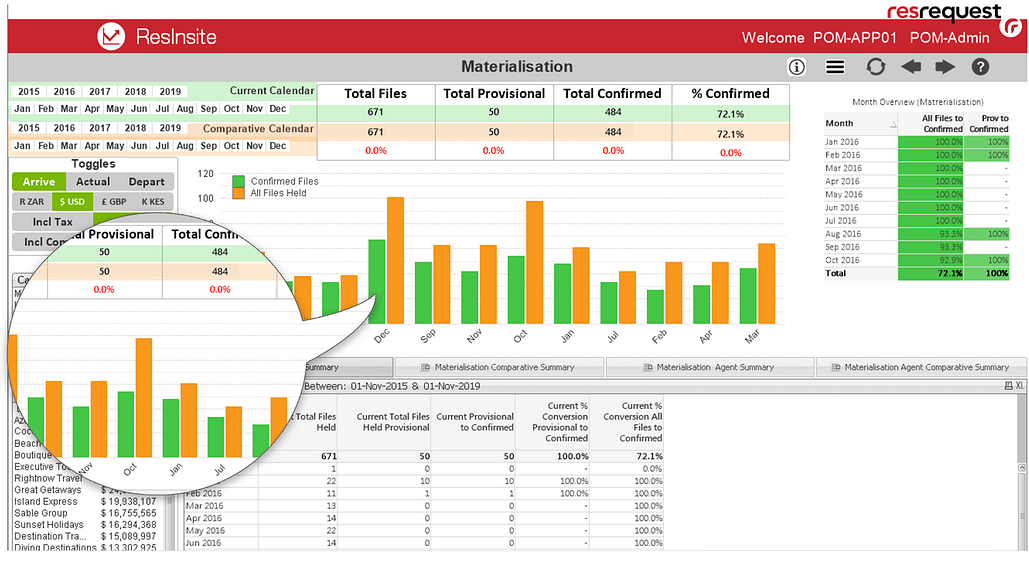
- Visually powerful, ResInsite allows you to ‘see’ your data.
- Fast and accurate reports are just a few clicks away – gone are the days of flat and time-consuming reports.
- ResInsite dynamically reviews all the key metrics of the hospitality framework.
- ResInsite is responsive to you the client, whether you need more-or-less from the platform we understand the data and can help you get the most out of your ‘Res-Insights’.
- Easy to use. Designed to ensure that no professional skills are required to leverage your data – just a willingness to dive into the results.
- Aggressively priced to ensure that ResInsite’s world-class analytics don’t break the bank but help you optimise your revenues.
- Ultra-Secure. ResInsite has been designed to keep your data in a highly secure environment.
- Fully supported by ResRequest and Pomerol Partners – help is just a click away.

ResInsite works on a per user licence agreement. Choose who gets to the see the app and even what they get to see.

You will need to sign up with Pomerol Partners by signing a comprehensive Non-Disclosure Agreement (that protects you and your data) and a Master Services Agreement that covers the nuts and bolts of access, billing and availability.
We meet with you to get a better understanding of your business intelligence needs, your specific pain points and the business logic that you employ. This allows us to deploy ResInsite in a manner that makes perfect sense to your organisation.
Data validation:
We customise a few simple settings that allows us to tailor ResInsite to your unique reporting methodologies. We will work closely with you to verify that the data is accurate and the figures and results that you are both used to and expect are reflected.
Going live:
We automate the process of gathering and aggregating your data from ResRequest. We show you how to navigate ResInsite, it’s tips and tricks and how to get the most of its’ suite of analytics. We monitor your usage and ensure that it’s deployed in an effective manner for your needs.
Support:
Pomerol Partners work in conjunction with ResRequest to ensure that issues are seamlessly resolved, and your questions effectively answered.
Customisation:
We listen to your needs and where appropriate will ensure that your ResInsite grows as fast as you do.
Billing:
Billing is processed monthly in advance. The cost of ResInsite is $155 per user per month. Further customisations and integrations into 3rd party applications (finance, accounting, HR, tour operator, etc) are possible, subject to standard consulting fees and are separate from user license fees.
Please contact [email protected] with any questions or to sign up for this product and service.

 Written by Paula Chaplin
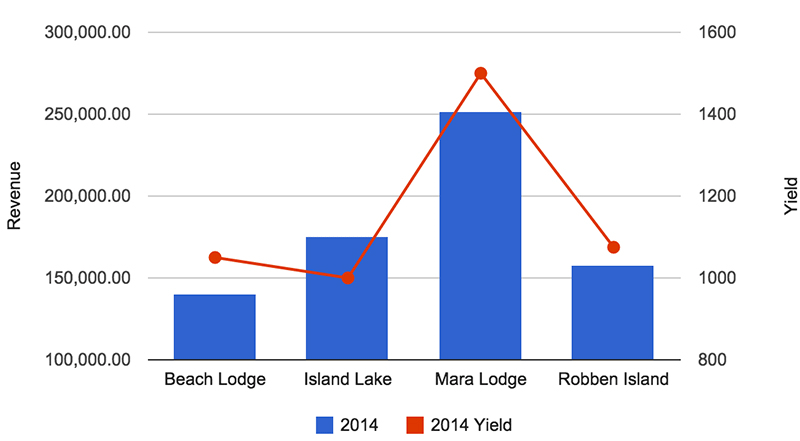
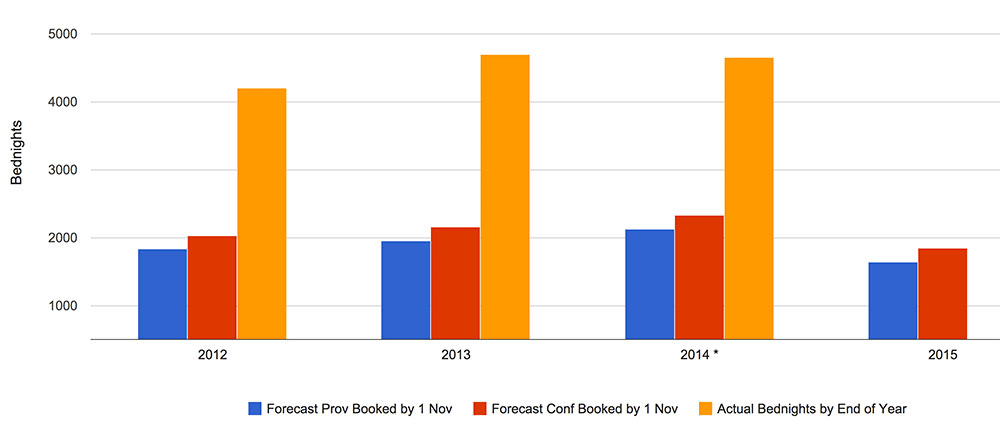 (To pull information for this graph: you need to run a report per year and stitch the information together. To see bookings as of 1 Nov 2013 for 2014: Travel Dates = 1 Jan – 31 dec 2014, Create Date = 1 Jan 2000 – 31 Oct 2013. Group by Status, showing Bednights.)
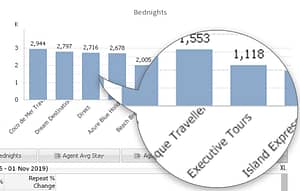
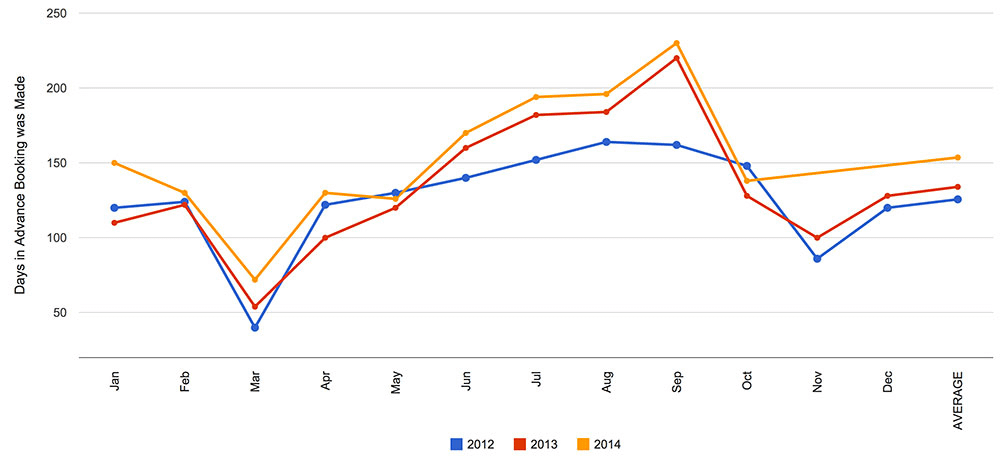 (To pull this report look at the FAR – Group by Create Date, and look at Arrival Date. Export the report and create a variance column between Arrival Date and Create Date – this is your lead time.)